How to Read a Rapport AI Roleplay Report and Use Cohort Analytics
Every Rapport roleplay with at least five exchanges ends with a scored performance report. This guide explains each part of the report, what the ratings mean, and how to use Cohort Analytics to turn individual results into a coaching plan for the whole team.
November 12, 2026
How to Read a Rapport AI Roleplay Report and Use Cohort Analytics
Key takeaways
- Reports are generated after a learner completes a scenario with at least five exchanges.
- The top of the report shows an overall score, a rating, one key strength, and one focus area.
- Each criterion gets a percentage and a rating such as Needs Improvement, Good, or Exemplary.
- The detailed evaluation quotes what the learner said, then gives analysis and specific improvements.
- Cohort Analytics rolls results up by scenario, date, learner, and source, with a choice of which attempt to count.
When a report is generated
Every learner briefing includes the same rule: you must have at least five exchanges to generate a report assessing your performance. Shorter sessions do not produce a score, so encourage learners to stay in the conversation even when it gets uncomfortable. That is usually where the learning is.

The criteria in the report come from the framework chosen when the scenario was built. You can preview any framework in step 4 of the builder; see how to create a custom sales roleplay scenario for details.
The summary: score, strength, and focus area
The top of every report answers three questions at a glance: how did I do overall, what did I do best, and what should I work on next?
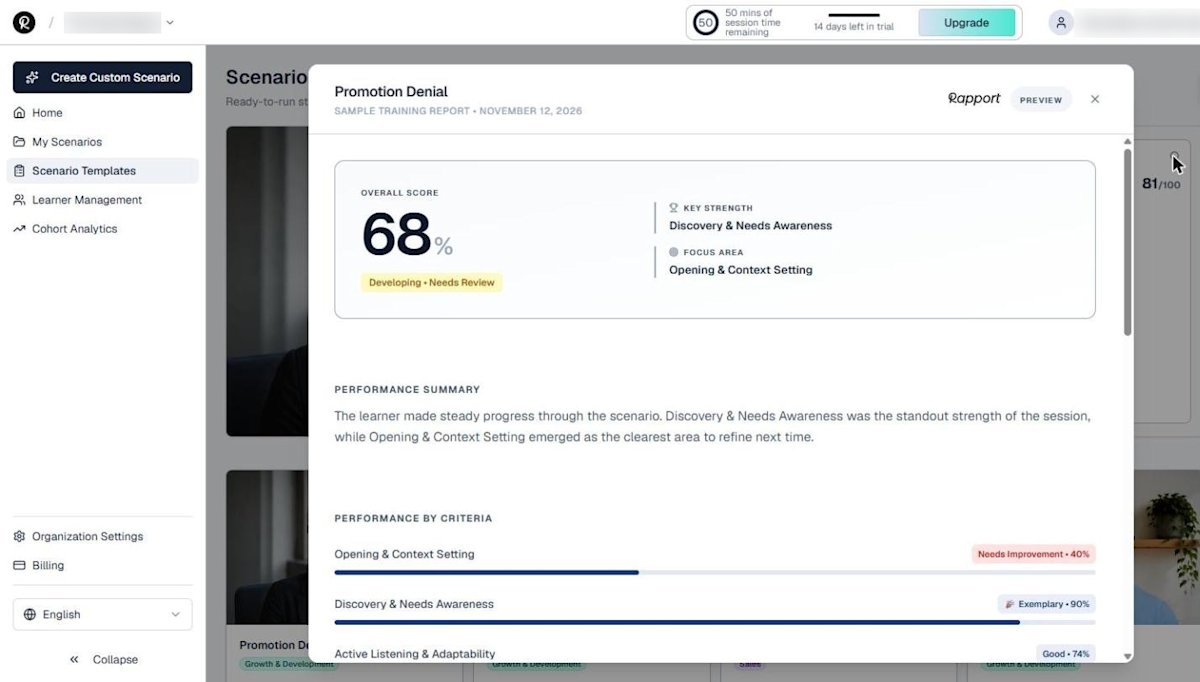
- Overall score: a percentage across all criteria
- Rating: for example "Developing, Needs Review" or "Good, On Track"
- Key strength: the highest-scoring criterion
- Focus area: the criterion with the most room to improve
- Performance summary: two sentences that tie it together
Managers do most of this coaching, which matters: Gallup has found that managers account for 70% of the variance in team engagement.
Performance by criteria
Next, each criterion gets its own bar, percentage, and rating label. Labels include Needs Improvement, Good, and Exemplary.
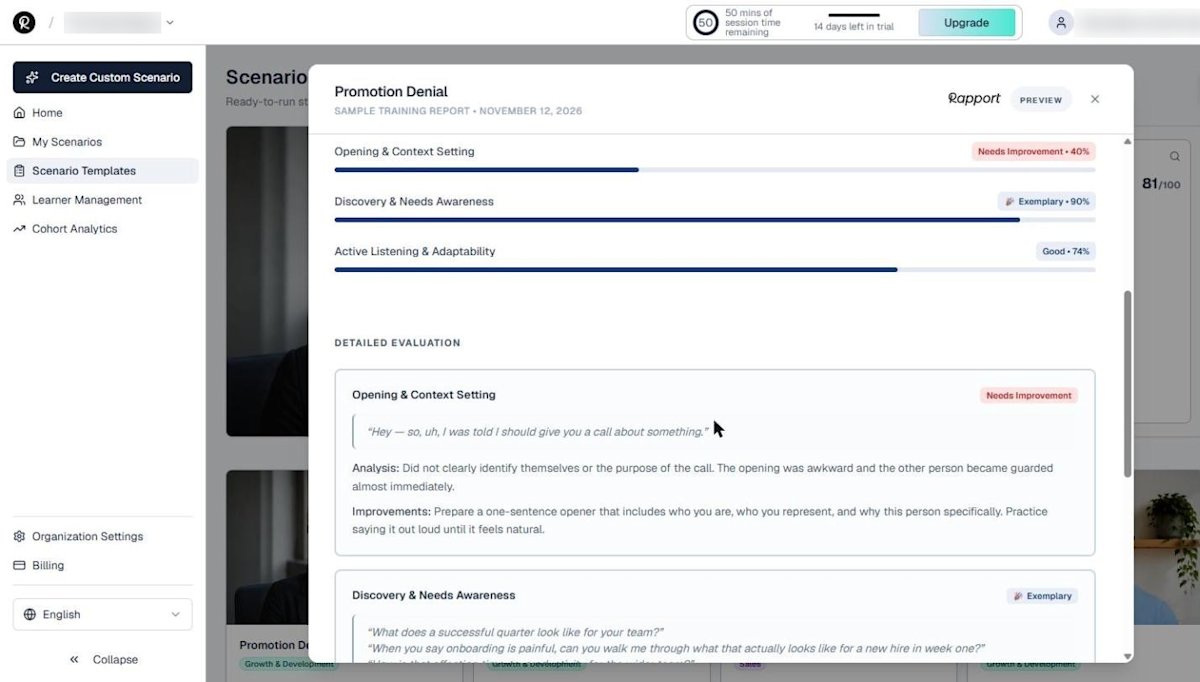
Scanning the bars shows the shape of a learner's skill. A rep who is strong at discovery but weak at the opening needs a different coaching conversation than one who builds rapport easily but never asks for a next step.
Detailed evaluation: quotes, analysis, improvements
This is the most useful part of the report. For each criterion, Rapport shows:
- Quotes: the learner's own words from the conversation
- Analysis: why that moment worked or did not
- Improvements: a specific, practical change to try next time
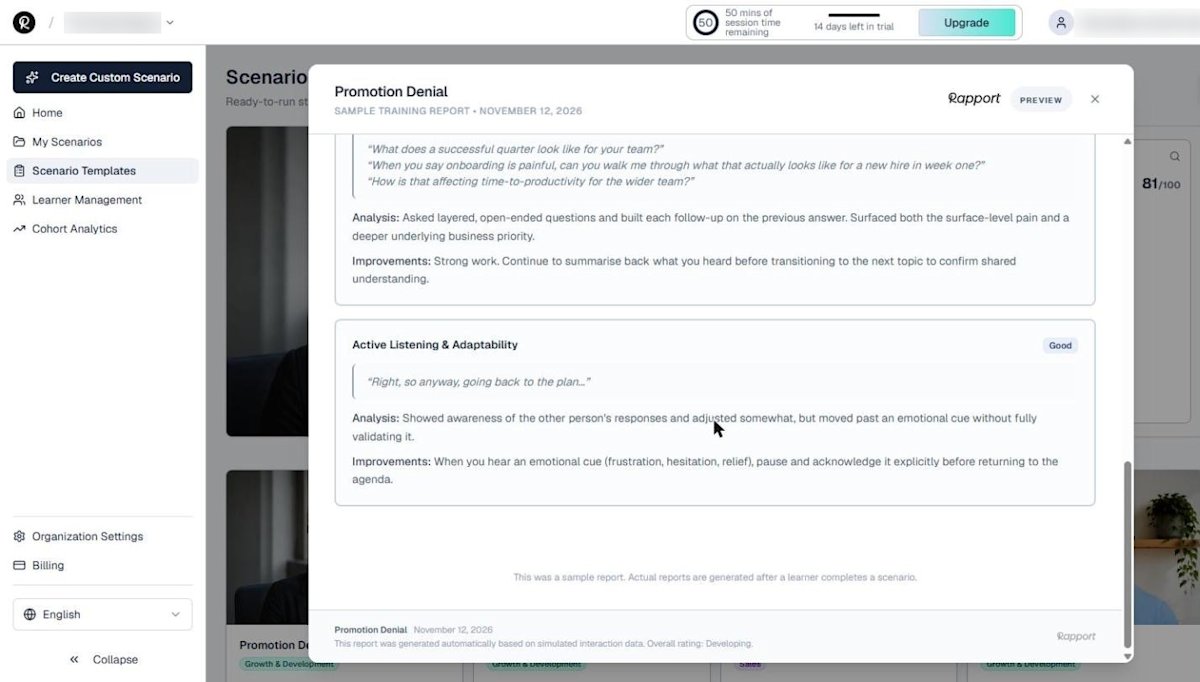
Feedback tied to observable behavior is easier to accept and act on than a general score. We go deeper on why in observable behavior feedback.
Research on simulated practice, such as Stanford's Rehearsal study on conflict resolution, points the same way: practice plus specific feedback changes what people do next.
Medical educators reached a similar conclusion comparing role-play simulation with real patient encounters.
Roll it up with Cohort Analytics
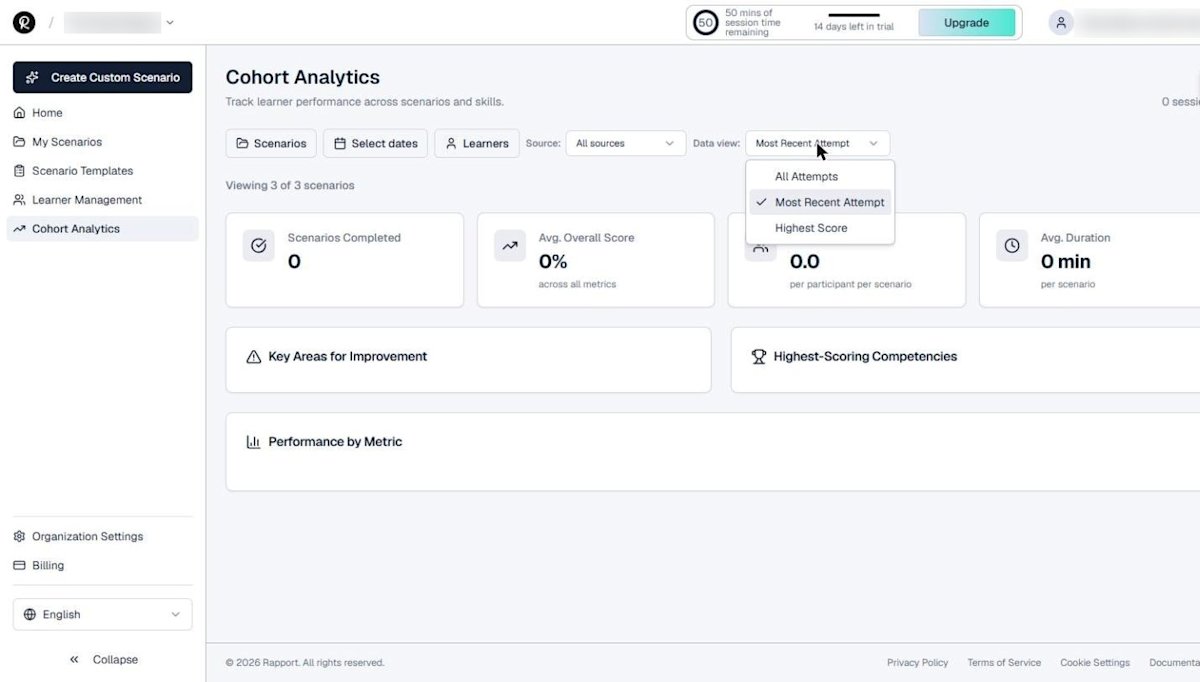
Open Cohort Analytics from the sidebar to see results across your team. The page shows Scenarios Completed, Avg. Overall Score, Avg. Attempts, and Avg. Duration, plus Key Areas for Improvement, Highest-Scoring Competencies, and Performance by Metric.
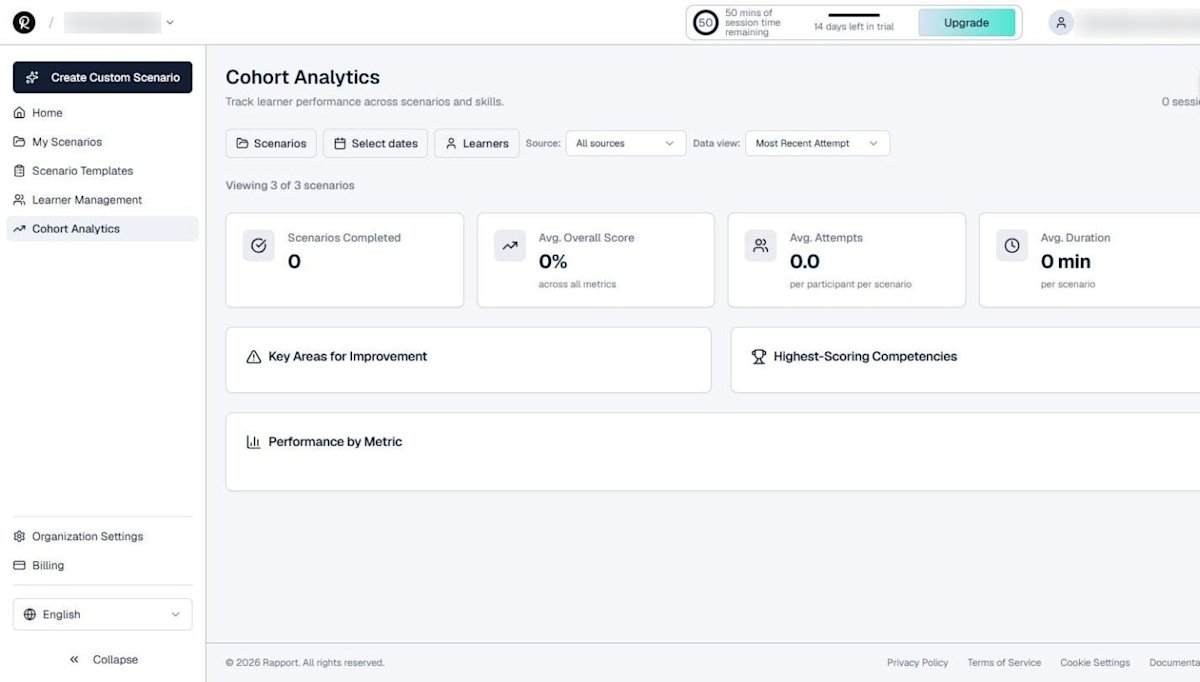
Filters let you slice the data by:
- Scenarios: one, several, or all
- Dates: any range
- Learners: individuals or groups
- Source: portal or LMS learners
- Data view: All Attempts, Most Recent Attempt, or Highest Score
Turn reports into a coaching plan
- Pick the lowest team-wide criterion in Key Areas for Improvement.
- Share two or three anonymized quotes from reports as examples in a team huddle.
- Assign the same scenario again with a single focus for the next attempt.
- Compare Most Recent Attempt against the first attempt after two weeks.
- Report readiness to leaders using the approach in measuring training readiness.
For manager-led coaching, ATD research on sales coaching is a useful benchmark.
Our training ROI calculator then helps translate score gains into business terms.
Still setting up? Start with the Rapport free trial tour.
When you are ready to roll out, learn how to share scenarios with learners.

See your first AI roleplay report
Start a free 14-day Rapport trial with 50 minutes of AI roleplay conversation time. No credit card required.