Completion Rates Are Not Readiness: What a Cohort Skill Dashboard Shows Instead
Every L&D leader knows a completion rate measures attendance. The harder question is what to put in its place on the slide that goes to the executive team.
This is about the four numbers that actually answer "can our people do this," and the specific way reading them out of order leads teams to the wrong fix.
September 22, 2026
Key takeaways
- Four metrics replace the completion rate: score by criterion, attempts per learner, improvement across attempts, and cross-scenario consistency.
- Never read a score without its attempt count. A low average after two attempts is a volume problem, and more content will not fix it.
- Per-criterion scoring is what makes coaching specific. "The cohort is weak on impact statements" is actionable. "The cohort is weak" is not.
- Cross-scenario consistency is the readiness signal. A skill that holds in one context and collapses in another was never a skill.
- Long-term trend reporting works from retained scores, not retained recordings, so measurement does not require a library of employees struggling.
Why the gap stays invisible
Readiness is usually assessed by the one person least able to assess it objectively: the learner. People leave a conversation with a felt sense of how it went, and that feeling correlates poorly with whether the conversation did its job.
There is a clean demonstration of this. At ATD Demo Day, an experienced executive ran a live conflict resolution roleplay.
It ended in agreement, a meeting was scheduled, and her stated impression afterward was that she was "pretty happy with this." The rubric scored it 45%.
Two of six criteria, describing observable behavior and explaining impact, came back flat. The full recap of that session has the whole exchange.
Scale that mismatch across a cohort and the problem is clear. Self-assessment reports readiness.
Completion reports attendance. Neither reports capability, and the distance between them is where expensive surprises live.
For why traditional systems cannot close this gap, see what your LMS can't show you about soft skills.
The four metrics worth tracking

Reading them in the right order
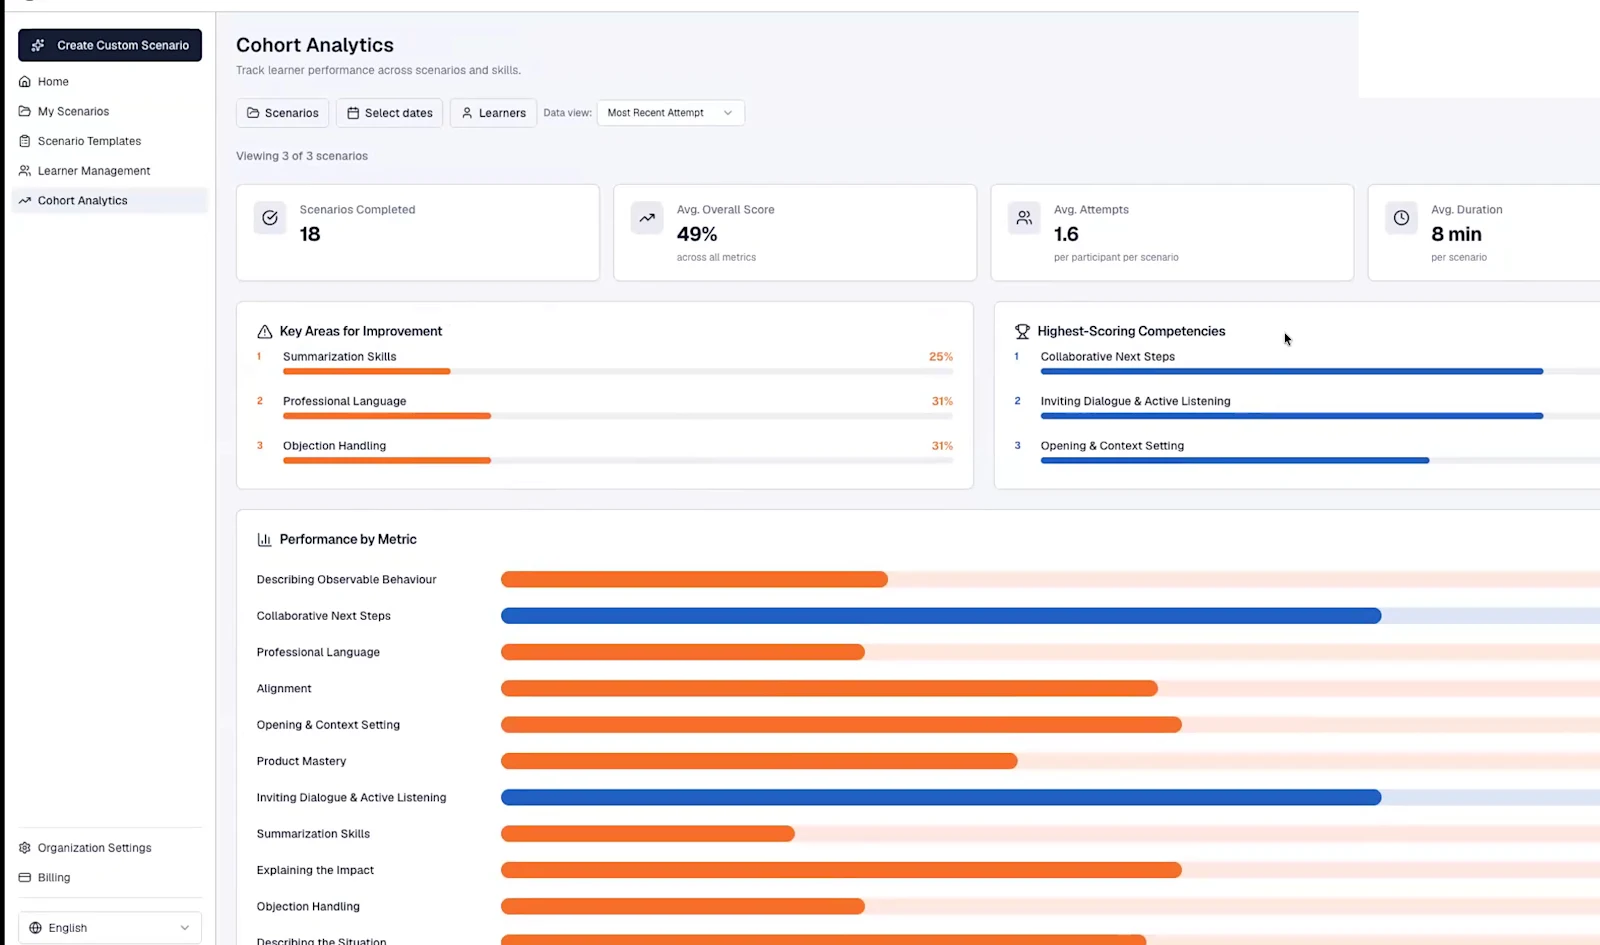
Here is the misdiagnosis, using the real cohort numbers shown live at ATD Demo Day. The dashboard reported a 49% average overall score across all metrics.
The instinct is to conclude the team is weak and commission more training.
Now add the second number: 1.6 average attempts per participant, per scenario, at an average duration of 8 minutes. That is roughly thirteen minutes of practice per person.
That is not a weak team. That is a team that has barely started.
The corrective action is not more content, it is more repetitions of what they already have.
The same score means two different things
Cohort average of 49 percent, read with and without the attempt count
The ranked lists make the coaching target concrete. In that same cohort view, the three weakest competencies were summarization skills at 25%, professional language at 31%, and objection handling at 31%, while the three strongest were collaborative next steps at 75%, inviting dialogue and active listening at 75%, and opening and context setting at 58%.
People start conversations well and end them well. The middle is where the points go.
The third metric resolves the ambiguity for individuals. Drilling into a single learner and comparing first attempt to best attempt tells you whether repetition is moving the number.
When one learner keeps going and their score climbs materially, the scenario is working and the cohort simply needs volume. That drill-down is what separates "this team is weak" from "this team has not started."
The related diagnostic process for sales organizations is in how to run a sales team skill gap analysis.
Generate one of these for yourself
Run a scenario, get the per-criterion report, and see the shape of the data before you design the cohort view around it.
Try a scenario →The readiness signal is consistency, not score
The fourth metric is the one most teams add last and should probably add first.
Take a single competency, say handling pushback, and look at how it scores across two or three different scenarios: a performance conversation, a customer escalation, and a negotiation with a senior stakeholder. A team that holds up across all three has the skill.
A team that scores well on one and collapses on another has learned a scenario.
This is why comparing scenarios matters more than optimizing a single average. In the Demo Day dashboard, performance was shown by metric across multiple scenarios precisely so a trainer could spot that pattern, then drill into individual learners from there.
Practically, this means designing your scenario set as a matrix rather than a list. Pick the three or four competencies your program certifies on, then build scenarios that stress each one in genuinely different contexts.
The scenario library gives you contexts to pull from, including high intensity conflict, managing up, and customer frustration. Designing them well is covered in how to design an AI roleplay scenario.

Building the view without building a surveillance tool
Two design decisions determine whether this measurement layer helps or backfires.
First, what you retain. Long-term trend reporting comes from retained scoring outputs rather than retained recordings.
In Rapport, audio and explicit transcripts are not stored long term, while high-level scoring outputs are, which is what makes a look-back window possible without keeping a library of employees being bad at their jobs. The full data picture is in AI roleplay and employee data.
Second, who sees what. Individual learner reports are not automatically delivered to supervisors.
Aggregate scores roll up to the cohort dashboard, and learners can export their own report to bring to a coaching conversation. This is a measurement decision as much as an ethical one: if learners believe every attempt is being graded by their manager, they practice to look good on attempt one, and the improvement metric stops meaning anything.
Where this lands for the executive conversation: you stop reporting how many people finished and start reporting which competency moved, by how much, over what period, and which one did not. That is a different kind of slide, and it is the one that supports a budget request.
For the wider business case, see the business cost of skipping soft skills and why most skills development programs don't stick.
Frequently asked questions
Why are completion rates a poor measure of training effectiveness?
They measure attendance. A completion confirms someone reached the end of a module, which says nothing about performance under pressure.
At ATD Demo Day, an experienced executive completed a conversation that ended in agreement and scored 45, because two required criteria were never addressed.
What should replace completion rates for soft skills training?
Four metrics read together: score by rubric criterion, attempts per learner, improvement from first to best attempt, and consistency of a competency across different scenarios.
What does a low cohort score with low attempts mean?
Usually a volume problem, not a capability problem. A team averaging 49% after 1.6 attempts per person has barely practiced.
Assign more repetitions before concluding anything about capability.
How do you measure soft skills objectively?
By scoring observable conversation behaviors against a rubric defined in advance, applied identically to every learner, with a score and written explanation per criterion. That produces cohort-comparable data in a way manager impressions do not.
Should managers see individual learner scores?
Not by default in Rapport. Aggregate scores roll up to the cohort view, and learners export their own reports for coaching conversations.
Enterprise customers with a documented reason can arrange broader access.
How far back can you track skill development?
A look-back window can be set to cover months, because high-level scoring outputs are retained even though audio and full transcripts are not.
Where to go next
Start with the ATD Demo Day recap for the session this data came from, and why managers score lower than they think for the criteria behind the 45. On the format itself, AI role play training is the pillar and AI roleplay vs manager roleplay covers when to use which.
L&D leaders should also see solutions for L&D professionals and SCORM compliance for how the data reaches your existing systems.
Report the competency, not the completion.
See what a cohort skill dashboard looks like with your own scenarios, your own rubric, and your own team's data behind it.
Book a demo → L&D solutions